
The most recent crime statistics released have revealed which parts of Croydon are the most and least violent.
The latest figures recorded by the Met Police show that 791 violent or sexual offences were reported in Croydon for the month of August.
Based on figures from three months prior, this is actually a decrease of 60 reported crimes.
The statistics are broken down into 14 categories, ranging from burglary, to possession of weapons, to drugs.
For the 27 different policing boroughs there is a clear difference when it comes to violent and sexual crime however.
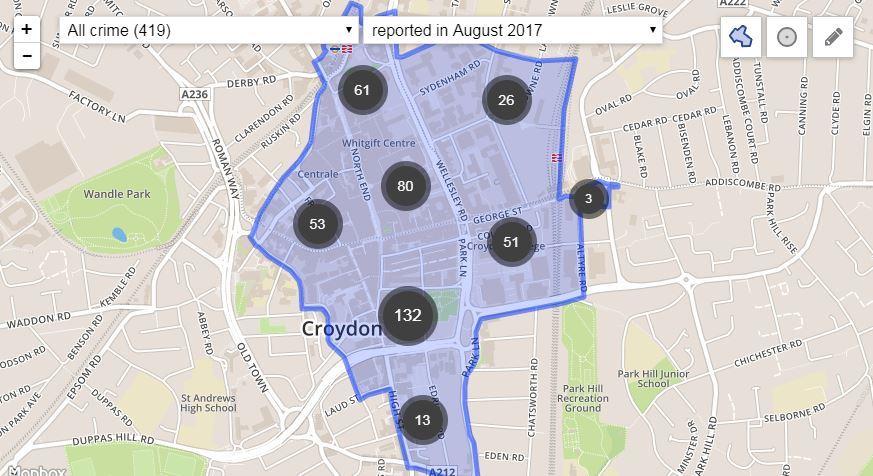
Croydon Town Centre had the most reported violent and sexual crimes with 93, which was an increase of 20 compared to the May figures.
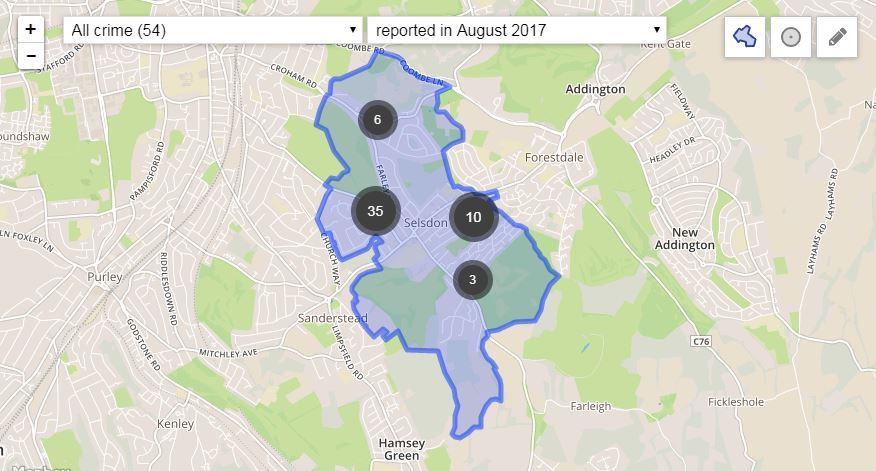
Selsdon and Ballards saw the fewest with just 5.
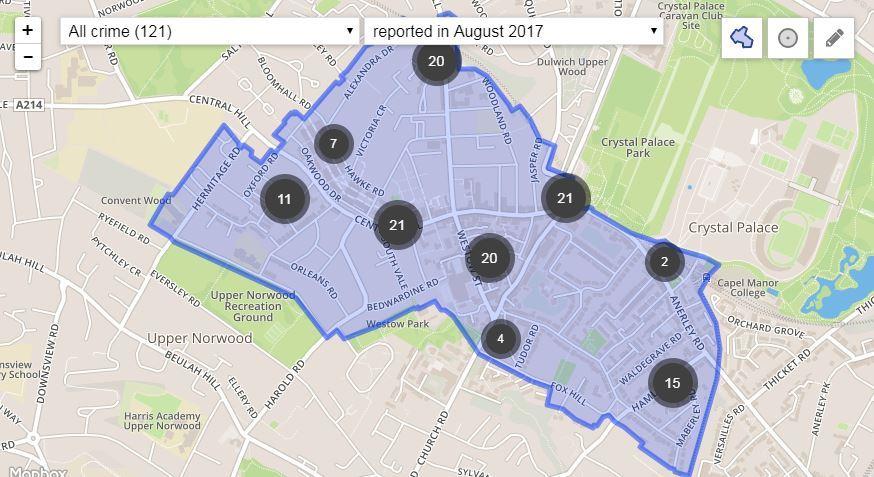
The biggest movers in terms of rankings were Crystal Palace and New Addington, which went from 23rd to a tie for 15th and New Addington which went from 17th to a tie for tenth.
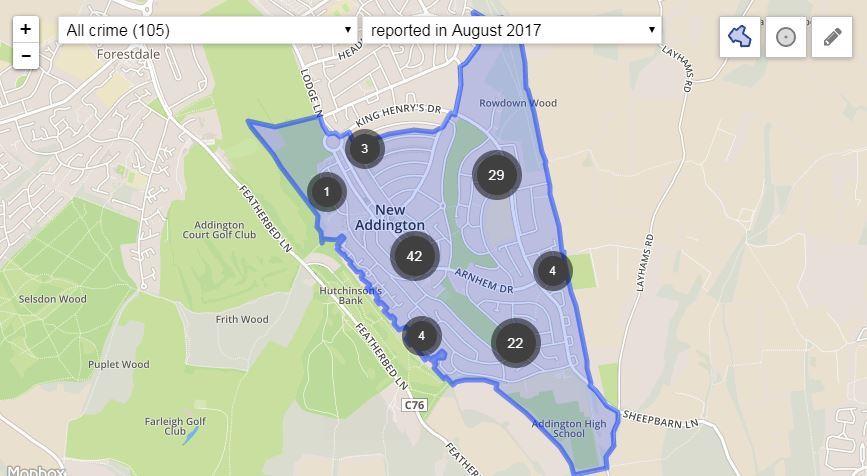
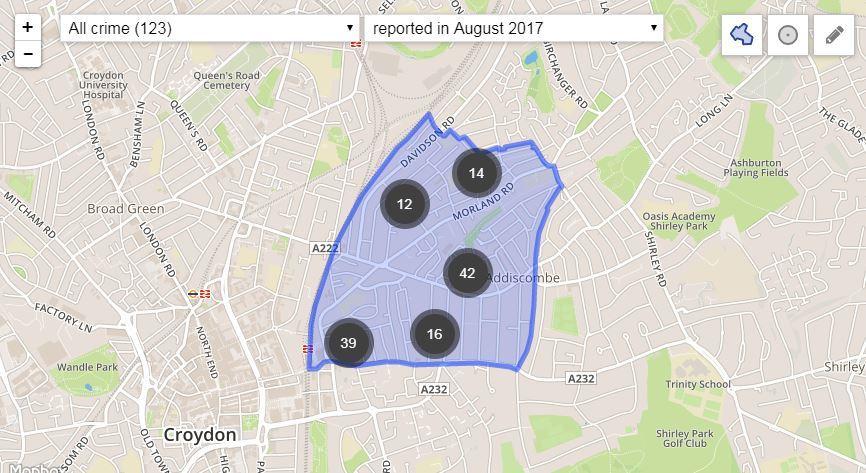
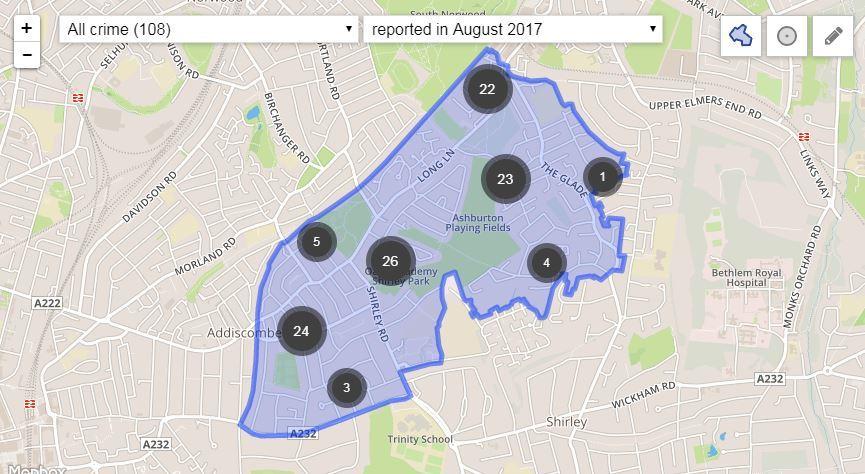
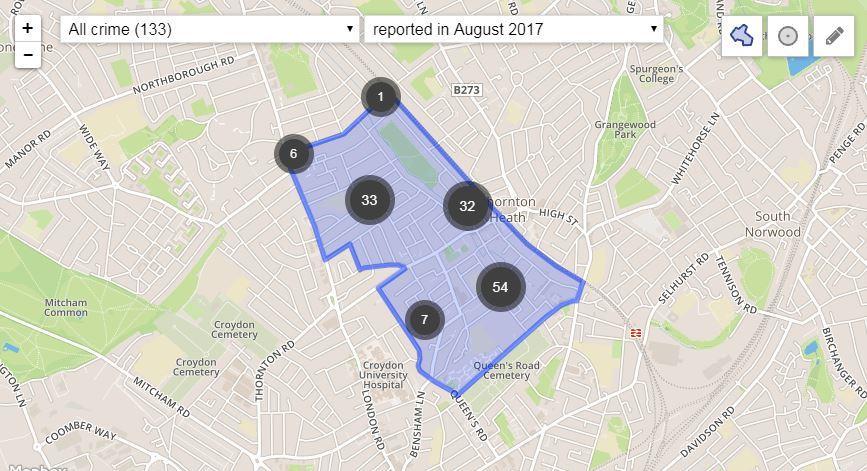
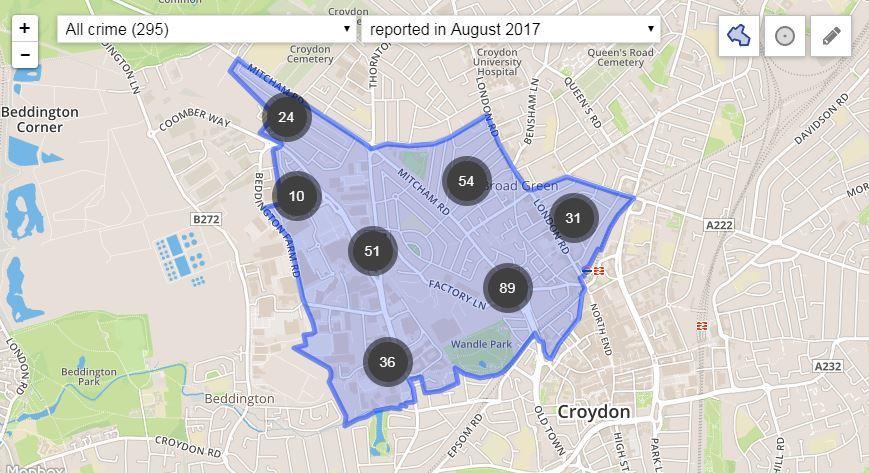
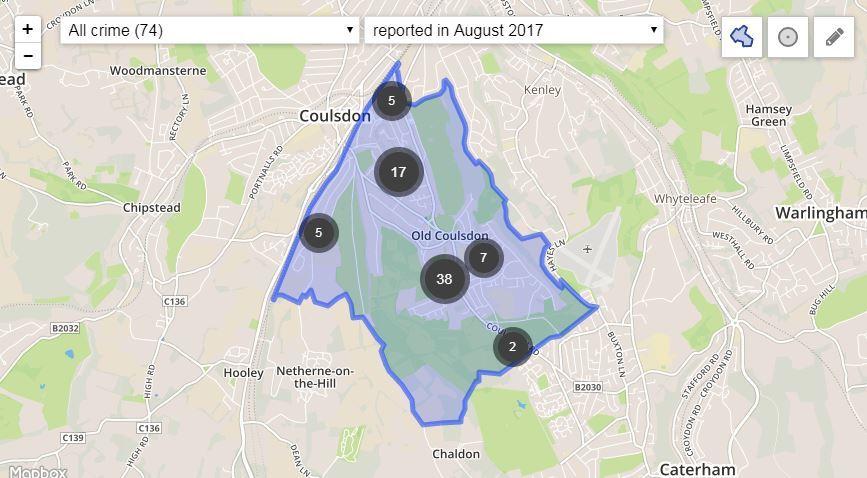
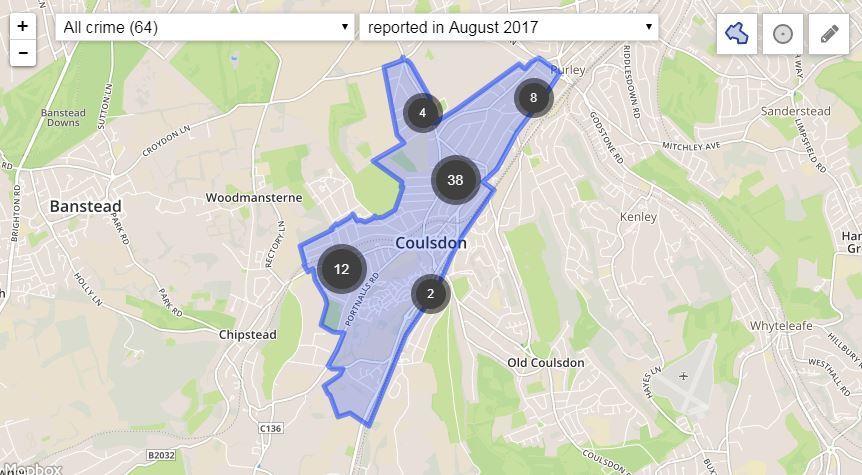
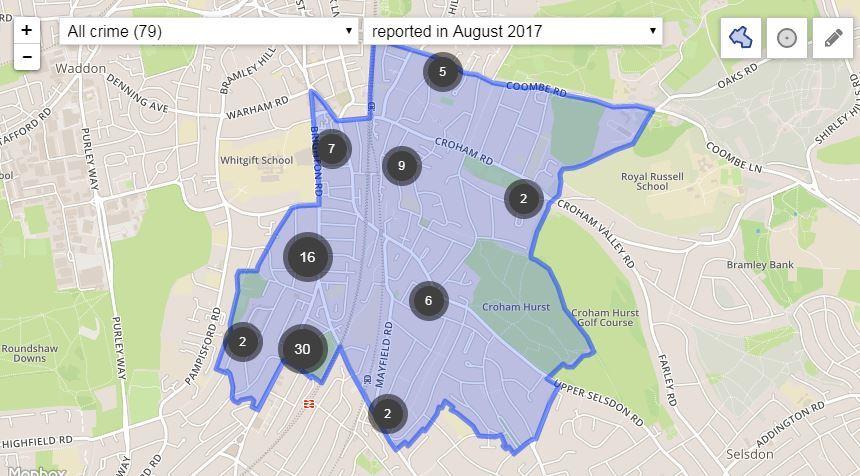
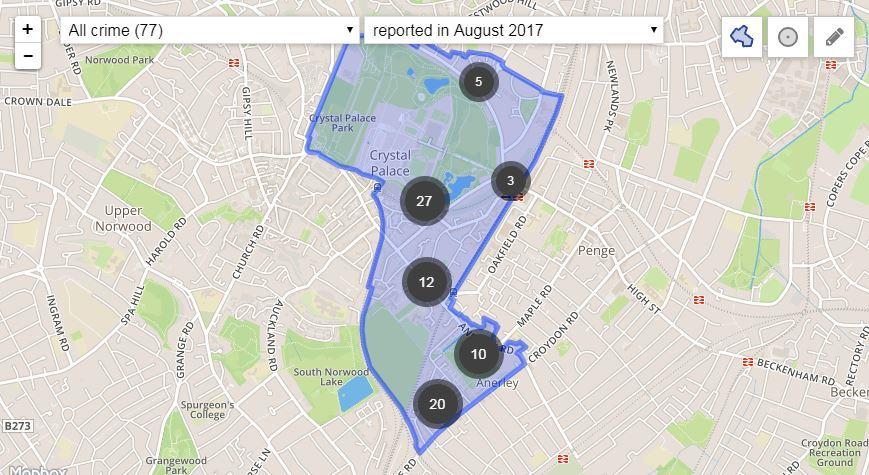
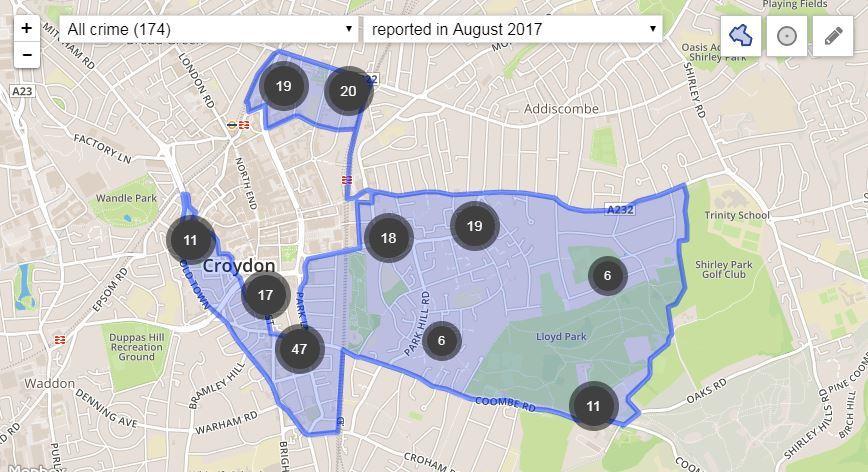
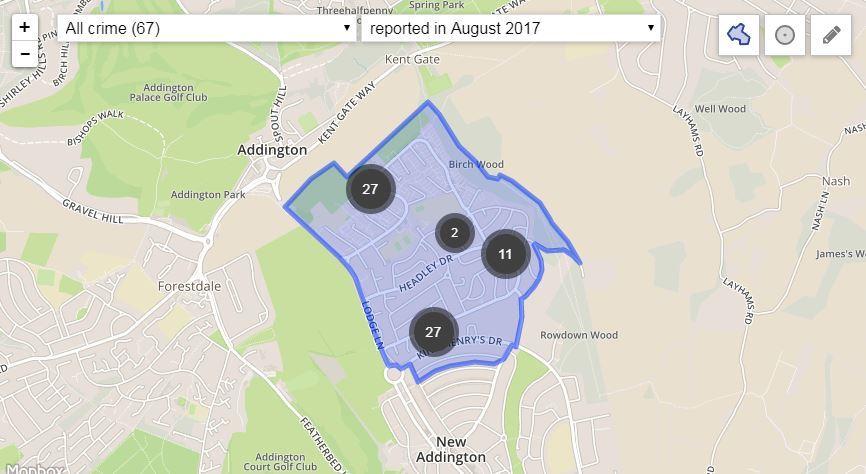
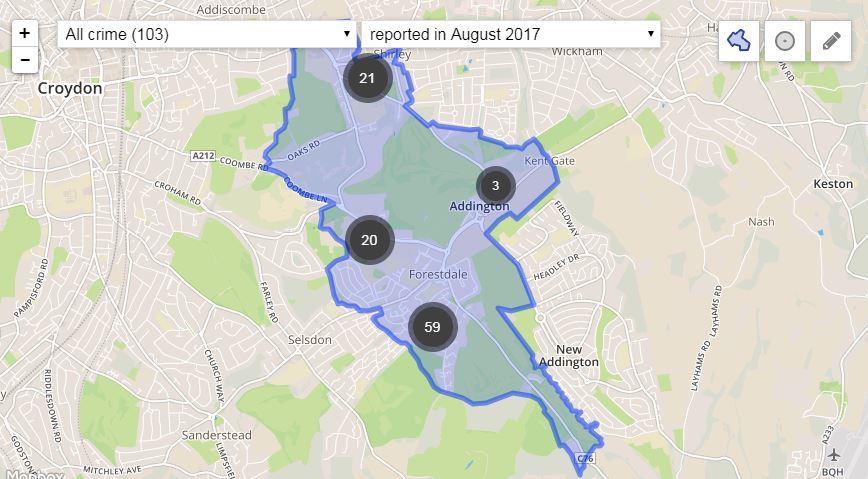
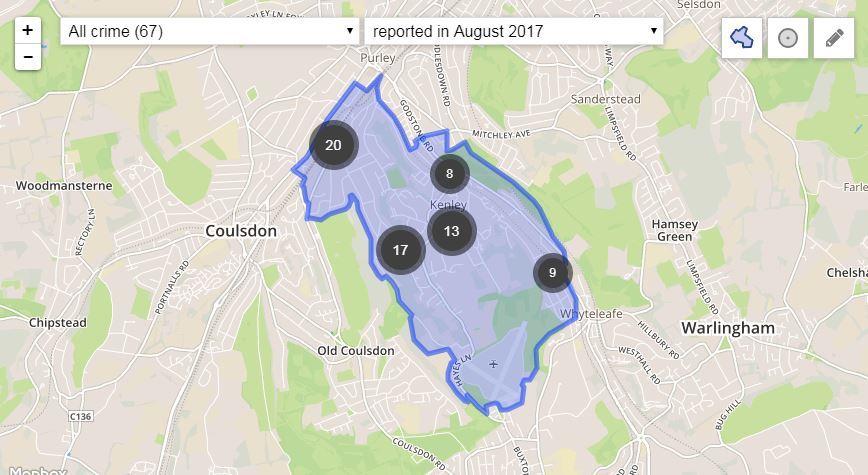
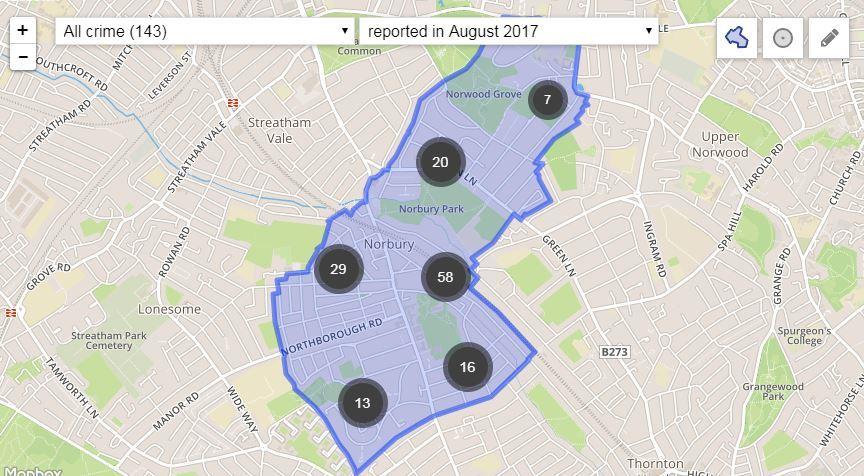
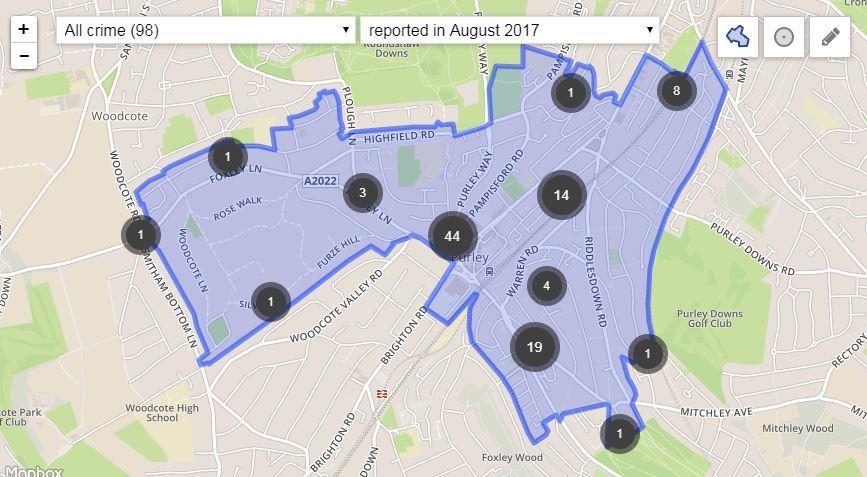
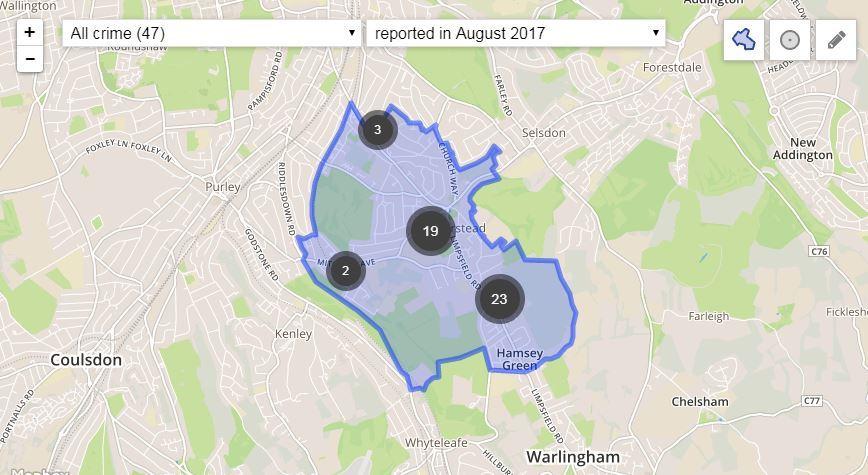
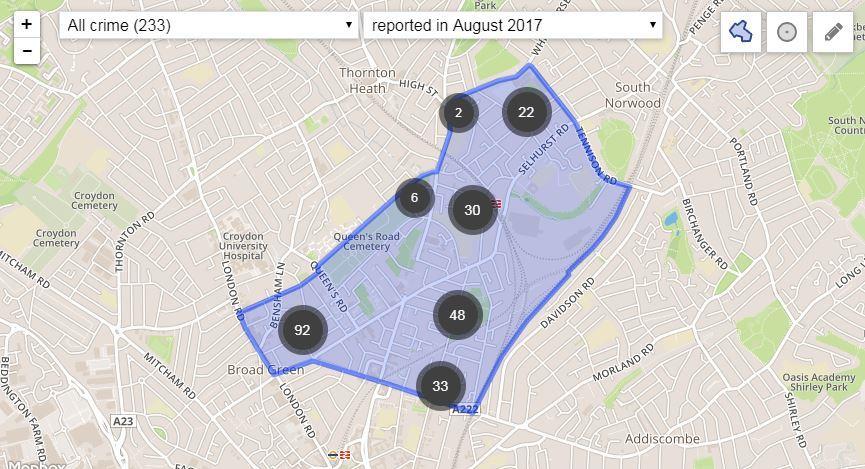
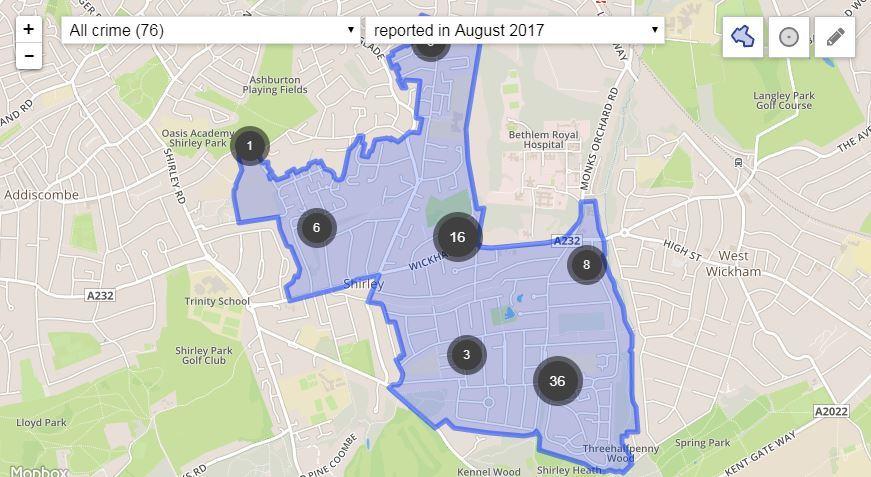
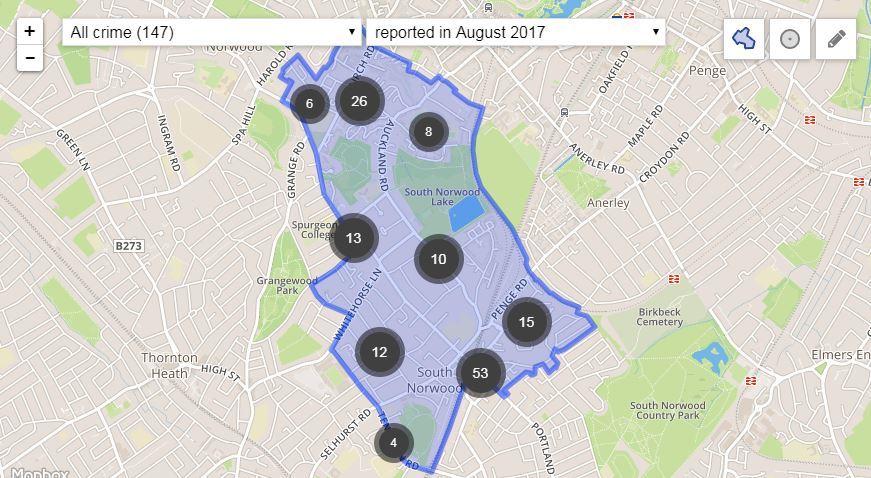
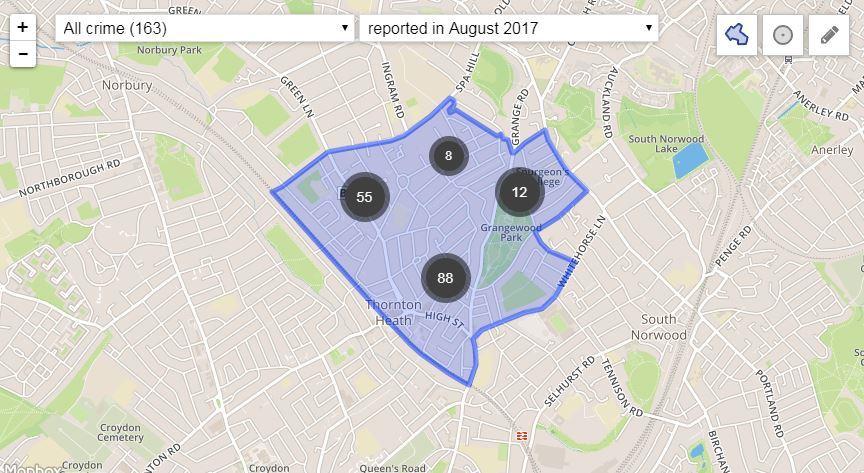
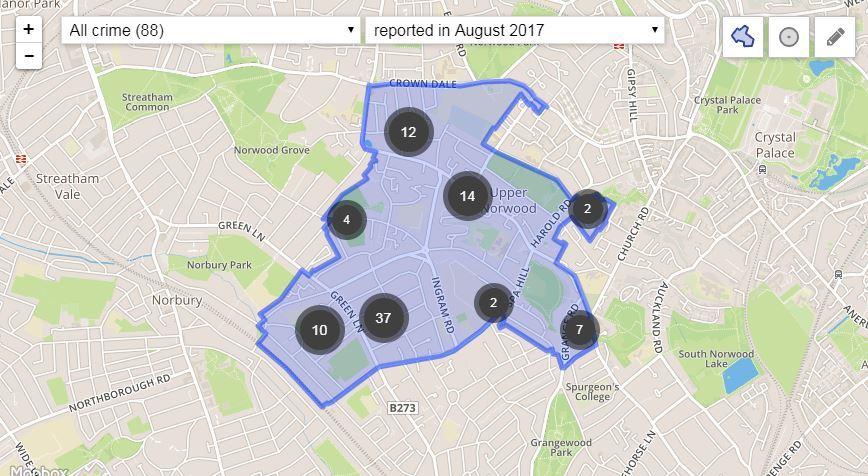
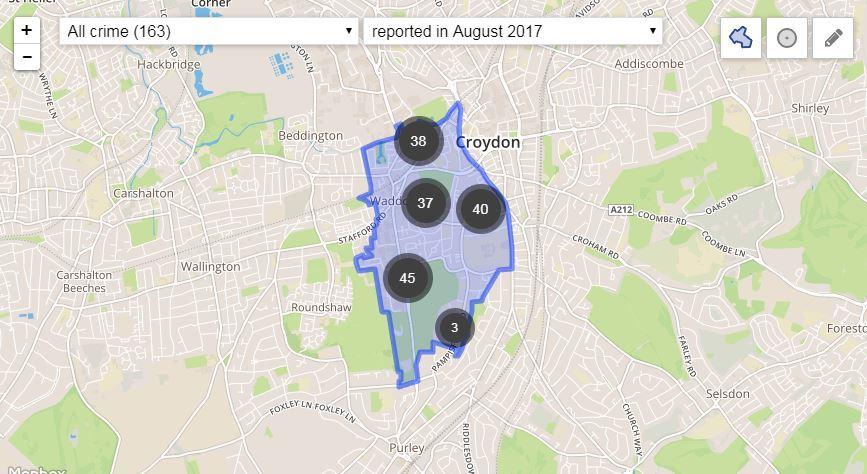
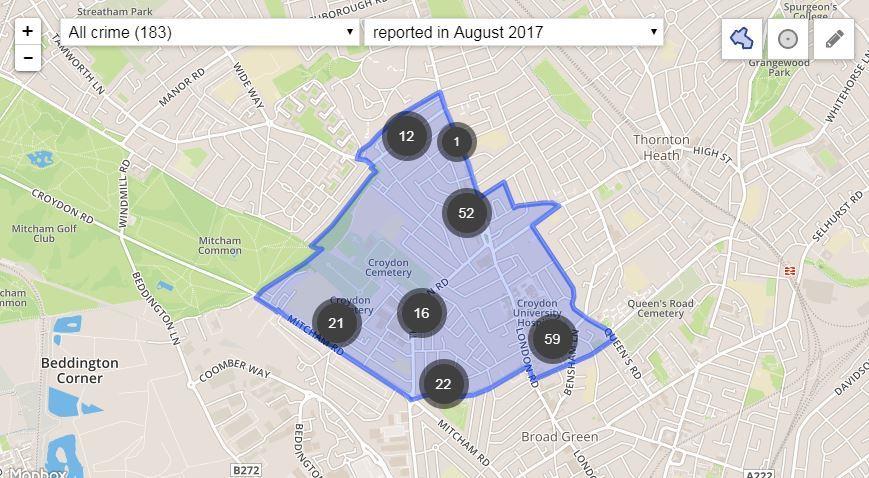
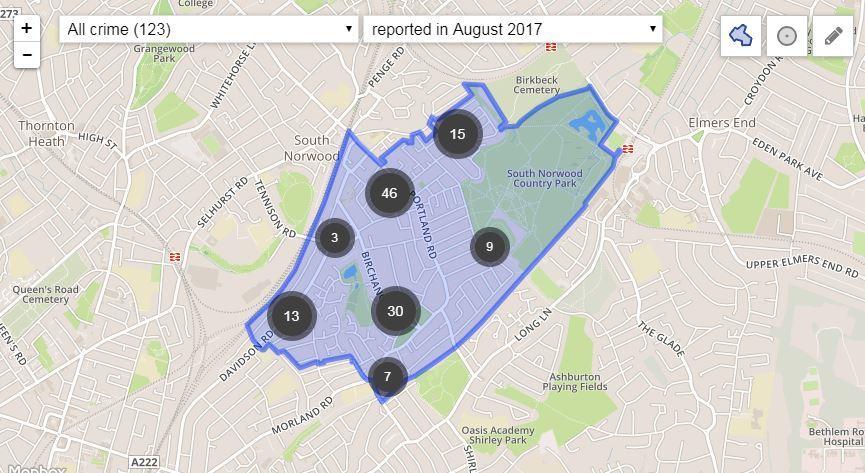
Click on the photos above to browse through the total reported crime numbers for each Croydon borough for August and also where in the borough those offences took place.
Below is a breakdown of every police ward in Croydon, ranked in order of the number of violent or sexual crimes recorded for the month of August and in brackets, the wards' rankings from May:
1. Croydon Town Centre – 93 (1)
2. Selhurst – 55 (3)
3. Broad Green – 49 (2)
4. West Thornton – 46 (8)
5. Thornton Heath - 45 (6)
6. Fairfield – 40 (4)
7. Bensham Manor – 38 (9)
7. Waddon – 38 (5)
9. South Norwood – 34 (6)
10. Addiscombe – 30 (15)
10. New Addington – 30 (17)
12. Woodside – 28 (14)
13. Norbury – 26 (11)
14. Crystal Palace Triangle – 25 (9)
15. Ashburton – 24 (16)
15. Crystal Palace – 24 (23)
15. Upper Norwood – 24 (18)
18. Fieldway – 21 (19)
19. Heathfield – 20 (13)
20. Shirley – 18 (21)
21. Croham – 17 (20)
22. Purley – 16 (12)
23. Coulsdon East – 13 (24)
24. Kenley – 12 (22)
25. Coulsdon West – 11 (25)
26. Sanderstead – 9 (27)
27. Selsdon and Ballards – 5 (26)


Comments: Our rules
We want our comments to be a lively and valuable part of our community - a place where readers can debate and engage with the most important local issues. The ability to comment on our stories is a privilege, not a right, however, and that privilege may be withdrawn if it is abused or misused.
Please report any comments that break our rules.
Read the rules here